ARVAL 26 & BEYOND


Corporate Fleets lead the change: Battery Electric Vehicles registrations surpass individuals in Europe
Arval Mobility Observatory
11 Dec 2025
A Market on the Rise
Battery Electric Vehicles (BEVs) continue to gain traction across Europe in 2025, with Q3 figures confirming strong growth compared to last year. While consumer adoption remains uneven, the shift to electric cars is speeding up overall.
Quarterly BEV penetration based on new vehicle registrations of Passenger Cars – Top 8 countries*
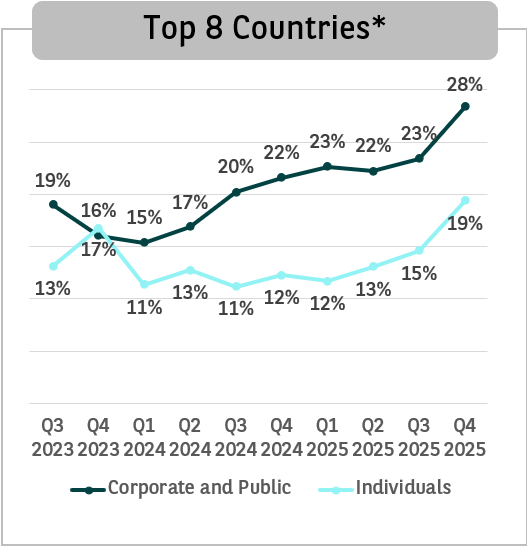
Source: S&P Global Mobility, October 2025 - Data is subject to change on a regular basis. For accuracy and reliability, users should always refer to the most recent official publications and updates before making decisions or drawing conclusions
*Top 8 countries in terms of registration (around 80% of the market in Europe): Belgium, France, Germany, Italy, the Netherlands, United Kingdom, Spain and Poland. Corporates market data: share of BEV in total registrations of Corporates; Individuals market data: share of BEV in total registrations of Individuals, source S&P Global Mobility.
Market Context
BEV Sales went up by 28%, reaching 1,9 million units in the first three quarters of 2025 compared to the same period in 2024, in Europe. A strong growth compared to an overall market only up by 0.2%. Four of the five biggest BEV markets saw strong growth: Germany (+40% vs +1% for the total German market), the UK (+33% vs +2% for the total UK market), Belgium (+14% vs -6% for the Belgian total market), and the Netherlands (+8% vs -19% for the total Dutch market), while France saw only a modest increase of 2% (vs -7% for the total French market).
BEV share remains highly uneven across Europe, with Nordics leading and Southern and Central Europe lagging behind.
The speed at which Europe transitions to electric cars has been depending heavily on regulations at EU level, such as Corporate Average Fuel Economy (CAFE) norms which may be amended in the context of the “Automotive Package” announced to be released soon.
At national level, regulations have also been playing a key role in electrification. Germany, for instance, has recently changed its regulatory framework regarding BEVs. A recent tax reform favored electric vehicles for companies by allowing accelerated first-year depreciation, making them more attractive for corporate fleets. This helped BEV penetration rise from 20% in Q3 2024 to 28% in Q3 2025.
Corporates as the Driving Force
Corporate fleets are emerging as a catalyst for BEV penetration. In several key markets, corporates have been major players of the transition to electric mobility thanks to their company car policies supported by tax incentives:
- Belgium: In Q3 2025, 55% BEV passenger car share in total registrations of corporates vehicles vs 11% BEV PC share in total registration of private vehicles
- Netherlands: In Q3 2025, 68% BEV share passenger cars in total registrations of corporates vehicles vs 34% BEV PC share in total registration of private vehicles
- UK: In Q3 2025, 36% BEV share in total registrations of Corporates vehicles vs 19% BEV PC share in total registration of private vehicles
This pattern reflects a strategic shift: organizations are leveraging BEVs to meet sustainability targets, and in the most advanced European countries, special incentives for cleaner cars are making this easier. In addition, the list prices of BEVs remain higher, their lower running and maintenance costs are shifting the Total Cost of Ownership - for Corporates - balance in the benefit of full electric cars compared to fuel or petrol cars1.
1 - Arval Mobility Observatory TCO White paper, Oct. 2025
Quarterly BEV penetration based on registrations of Passenger Cars - Details per country
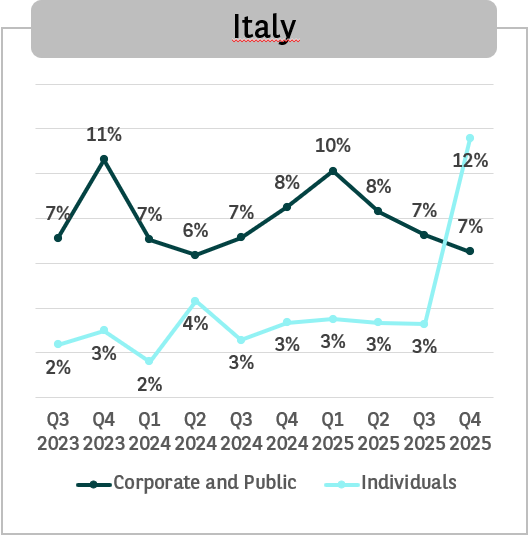
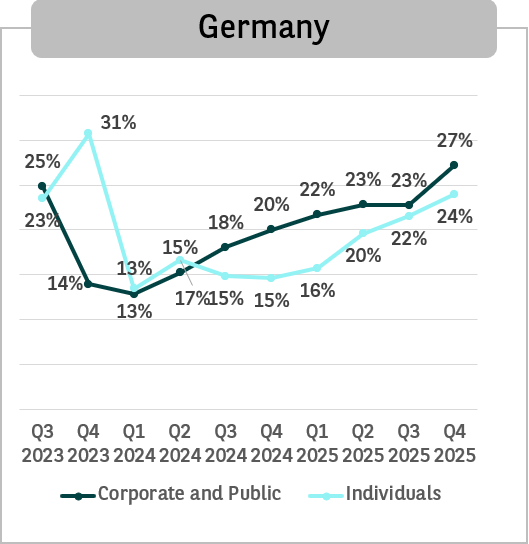
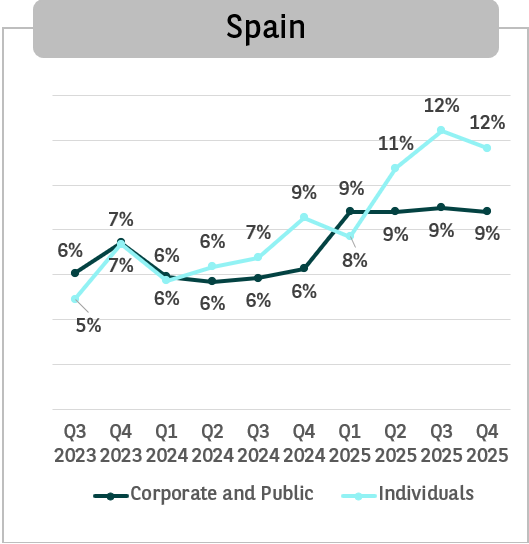
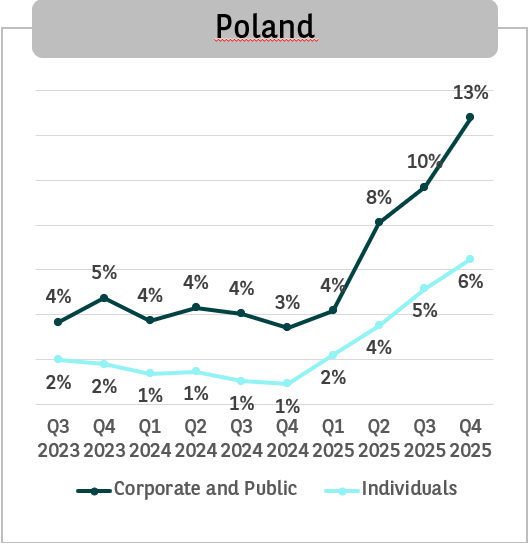
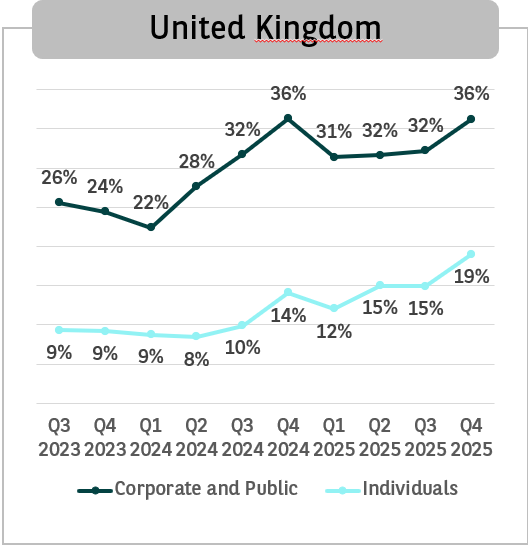
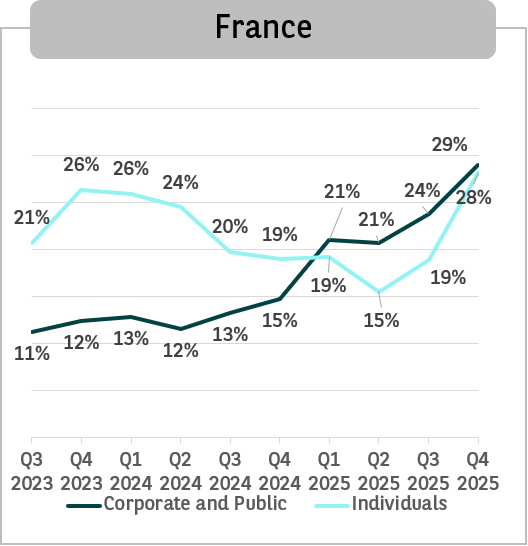
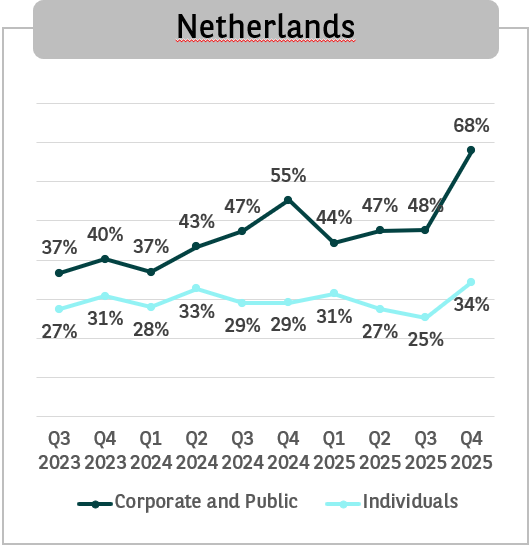
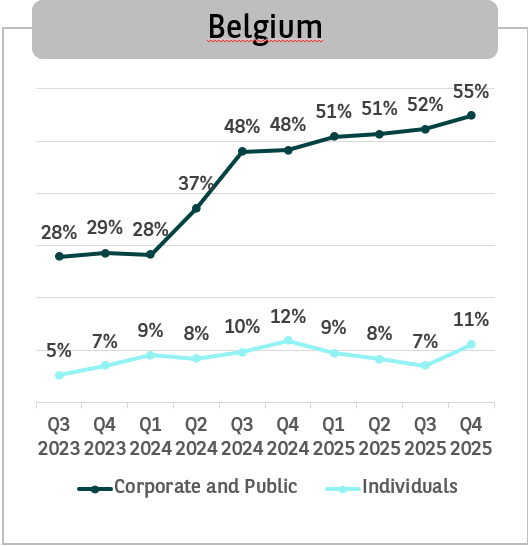
Source: S&P Global Mobility, October 2025
Disclaimer: Data is subject to change on a regular basis. For accuracy and reliability, users should always refer to the most recent official publications and updates before making decisions or drawing conclusions. S&P Data or Charts shall never be incorporated into a registration statement, securities related filing, prospectus, public or private debt issue documentation, any bond issue documentation or other offering document. S&P Data are provided by S&P "as is".
S&P hereby expressly disclaims any and all liability resulting from disclosure of the S&P data or chart to third parties and/or third party's use and/or reliance on the S&P data or charts for any purpose.