ARVAL 26 & BEYOND


Light Commercial Vehicles: Pragmatic Progress in an Evolving Market
Arval Mobility Observatory
27 May 2026
The Light Commercial Vehicles (LCV) market is often perceived as complex and constrained – amid emissions regulation, infrastructure constraints, and several years of contracting volumes. The reality is much more nuanced.
The 31 million LCVs in circulation across the EU contribute €860 billion in gross value added to its economy. Yet this is a market that’s frequently characterized as being under pressure. The data reinforces that perception to a degree: new LCV registrations across the EU fell by 8.8% in 2025. But it also challenges it: within that declining market, electrically-chargeable vans nearly doubled their share from 6.1% to 11.2%. In Q1 2026, the share of registration of eLCVs even increased by 42%, reaching 43,441 units. This is hardly the profile of a market in crisis.
This is an operationally mature market, built on well-established, resilient use cases and procurement frameworks. Disruption is not the right path to a stable future. The incremental improvements it’s already experiencing – driven by regulatory evolution, technology progress, and better alignment between vehicles and real-world usage – provide the blueprint for success.
For fleet managers, procurement directors and mobility leaders, the question is clear: how can this highly standardized market continue to evolve without changing its proven operational model – and what role will electrification realistically play?
Market Fundamentals: Stability as an Asset
Of all the misconceptions about the LCV market, one of the most enduring is that its complexity demands complicated fleet strategies. In reality, market practices remain highly standardized. A limited number of models still cover most professional needs as there are four main activities in which LCVs are used (construction, delivery & logistics, retail & wholesale, and technical services. And, despite a high degree of modularity at product level, volumes remain concentrated on a narrow set of configurations.
Main business sectors using LCVs
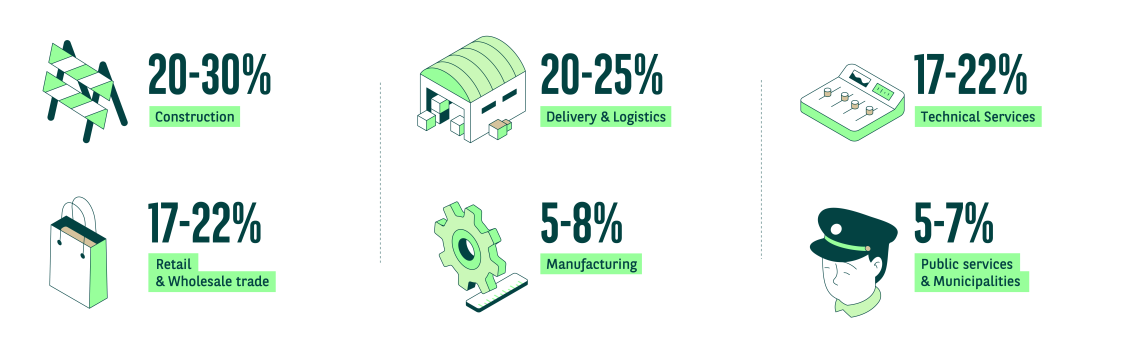
This standardization is an advantage, not a constraint. Factory-standard vehicles offer predictable maintenance costs, access to broad OEM network servicing, and controlled total cost of ownership (TCO). When modification is required for specific use cases – such as refrigeration and last-mile delivery configurations – modular kit-based solutions can be applied without compromising the benefits of standardization.
Empowered by this stability, operators don't need to rethink their fleet decisions. The Arval Mobility Observatory's Global Fleet and Mobility Barometer 2026 confirms that most LCV use cases remain structurally compatible with existing operational frameworks. All that’s required are targeted adjustments: powertrain selection, charging infrastructure alignment, and route optimization.
What has altered is not a return to growth-led expansion, but the context in which the market now operates. Q1 2026 figures point to a modest stabilization in registrations, largely supported by electrified powertrains. Growth through registrations increase is no longer the main market driver. The industry must generate value through efficiency gains, smarter powertrain choices, and better alignment between vehicle specifications and actual duty cycles.
Q1 2026 registrations show that electrified powertrains are now materially influencing overall market performance. This does not signal mass conversion, but rather a clear shift in how the market absorbs regulatory and economic pressure.
Electrification: From Caution to Selective Deployment
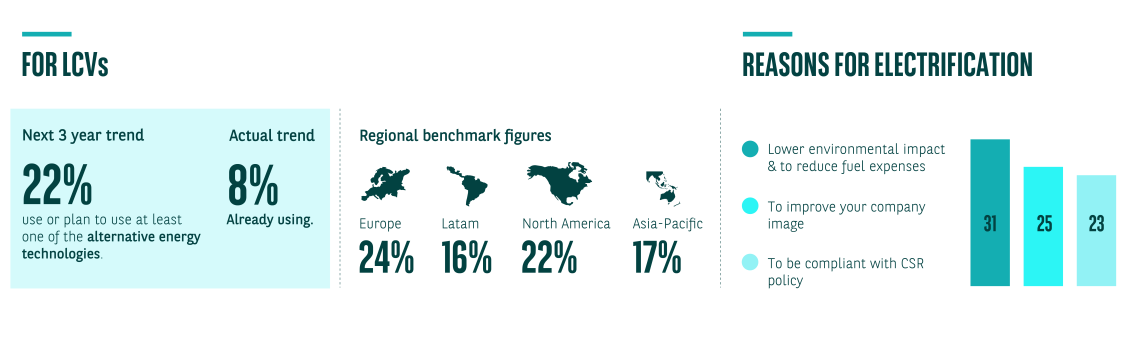
Once viewed through a lens of infrastructure anxiety and range limitations, fleet operators' perspective of electrification has evolved considerably. The Arval Mobility Observatory's Global Fleet and Mobility Barometer 2026 highlights this shift: alternative energy is now firmly integrated in corporate fleet strategies, with 66% considering or already using alternative energy technologies (BEV, HEV, PHEV). However, the electrification strategy for LCVs is lagging behind the one for passenger cars as only 22% are considering or using this technology.
Extract of the 2026 Barometer results showing the percentage of respondents using or considering using alternative energy technologies (BEV, HEV, PHEV)
The constraints have been widely documented and are well understood:
- The lack of adequate charging infrastructure remains the number one obstacle, cited by 67% of companies for LCVs.
- Battery weight can push certain electric vans from the N1 into the N2 category – N1 covers LCVs’ maximum gross vehicle weight, N2 covers medium-sized goods vehicles – prompting operational overheads that alter TCO calculations. While regulatory initiatives at EU and national level – including the proposed permanent 4.25‑tonne allowance for zero‑emission vehicles under a B licence – aim to mitigate the impact of battery weight, real‑world fleet experience shows that N1/N2 reclassification can still trigger additional operational constraints, making early integration of this issue into vehicle specification essential.
- For operations involving long inter-urban distances or unpredictable routing, energy management remains complex.
Companies are being proactive in the face of these challenges by building multi-layered charging strategies: 56% either operate or are preparing onsite charging capabilities, and 67% are turning to public charging networks[1]. Misplaced theories about the constraints of electrification are being replaced by operational evidence of its viability in defined use cases.
The result is a more grounded assessment of eLCVs operational output. For defined route profiles with overnight depot return, the case has become difficult to argue against on operational or economic grounds. For mixed-use fleets with variable daily distances, a phased approach – electrifying the most compatible segments first – is proving the most effective entry point, allowing experience, acceptability and quick results.
Technology Update: What Has Tangibly Improved
Compared to just a few years ago, fleet managers now have access to a significantly broader range of eLCVs, covering different sizes, payloads, body types, battery options and charging performances — enabling far more precise matching between vehicle specification and operational need.
Technological progress in the LCV market is incremental but meaningful. While none of the advances represent a fundamental reimagining of LCV operations, collectively they address the perceived constraints of electric powertrains and the operational reality of running them at scale.
Range
The discussion around eLCVs has gradually shifted away from maximum range figures towards a more operational question: matching the right vehicle—and the right battery size—to actual duty cycles.
Real-world autonomy for newer eLCV models has improved significantly. For example, the Kia PV5 provides an all-electric range (AER) of up to 416 kilometers – which is more than enough for short-distance urban delivery and suitable for longer regional operations. The gap between rated range and real-world performance has also narrowed, improving planning confidence.[2]
Similar efficiency gains are also visible on established LCV platforms. Recent updates to models such as the Renault Master E‑Tech illustrate how manufacturers are improving electric range through platform optimization and aerodynamic design, contributing to reductions in energy consumption of around 27% compared with previous generations. This supports the broader shift towards efficiency‑driven electric vans aligned with professional use cases, rather than a focus on maximum declared autonomy.
Charging performance
Many current eLCV models support rapid DC charging – a method of feeding power directly into the battery at high speed, bypassing the vehicle's onboard charger – such as the Kia PV5, which allows up to 80% state of charge within approximately 30 minutes on suitable infrastructure. Additionally, depot smart charging – overnight charge sequences that optimize grid draw and energy cost – has become a standard capability that reduces operational constraints.
Battery innovation
Advances in battery efficiency, thermal management and durability improve predictability and operational confidence. For example, Arval's analysis of 24,000 State of Health certificates across 11 European countries reveals that battery degradation is far lower than market perceptions suggest – retaining 93% capacity at 70,000km and remaining above 90% capacity at 160,000 km. In some advanced deployments, fleets are also integrating on‑site energy management solutions – such as stationary batteries combined with solar generation – to further smooth energy costs, although these setups remain specific to certain operational contexts.
All these innovations will be supported by a regulatory framework that strengthens transparency: By 2027, battery health will be visible directly on the dashboard of new models, and each battery will have a Battery Passport tracing its history and certified capacity.
From Constraint to Calculated Response
Effective constraint management in LCV electrification relies more on governance, discipline and economics than technology alone.
Charging infrastructure remains the most common constraint. Public network coverage is expanding and improving with wider access to fast charging, but remains uneven, and the ratio of chargers to electric vehicles has tightened as uptake accelerates. For LCV operations, public charging is not a primary requirement. Depot charging, optimized for overnight cycles, can power the core fleet. The operators who struggle are those who fail to define upfront and to diversify their charging strategy.
The theoretical TCO benefits of eLCVs – such as lower energy cost per kilometer and reduced routine maintenance – are genuine, but require the right conditions to become reality, such as sufficient annual mileage and controlled charging costs. Procurement decisions informed by acquisition price alone, without considering risk management, consistently produce poor outcomes.
Previously an afterthought, human factors are increasingly integrated upstream. Arval's Head of LCV/eLCV Anne-Lise Castel explains that professionals consistently cite "the need for digital tools and driver training" alongside infrastructure and cost as key operational constraints – inserting human factors firmly alongside technical ones. Driver behavior directly affects energy consumption and range, making early engagement with vehicle capability and charging protocols a priority.
Beyond infrastructure and driver behavior, data has become a central enabler of eLCV performance management. Monitoring real consumption, analyzing energy cost per kilometer, optimizing depot charger usage rates, identifying downtime inefficiencies or analyzing route suitability for electrification all rely on accurate and actionable fleet data.
Operations that integrate driver training, charging optimization and operational communication into eLCV rollout see faster adoption, fewer operational disruptions, and more reliable TCO outcomes.
Controlled Evolution, Not Revolution
The LCV market is not undergoing an upheaval; it’s responding to macroeconomic pressure, tightening regulation, and the demands of electrification through pragmatic adaptation.
This is a market in controlled transition. Volume contraction and electrification expansion appear contradictory on the surface, but look deeper, and they reflect a market recalibrating amid efficiency gains, powertrain optimization, and evidence-based fleet renewal – not forcing growth through structural disruption.
The constraints are understood, the technology is evolving, and operational experience is replacing misconceptions with reality. Incremental, disciplined progress within an established operational model is the path being taken across European fleets. Operators aren’t waiting for transformation; they’re adjusting decisions where conditions have evolved.
[1] Basis : companies with Corporate Vehicles (Passenger cars & LCVs)
[2] When referring to real-world autonomy, figures are based on independent tests conducted under defined conditions (payload, driving mix and temperature), rather than WLTP certification values